Seite 2: inno3D Geforce GTX 980 Ti iChill X3 DHS - Hochgezüchtete Transformer-Karte

GameStar Plus Logo
Weiter mit GameStar Plus

Wenn dir gute Spiele wichtig sind.

Besondere Reportagen, Analysen und Hintergründe für Rollenspiel-Helden, Hobbygeneräle und Singleplayer-Fans – von Experten, die wissen, was gespielt wird. Deine Vorteile:

Alle Artikel, Videos & Podcasts von GameStar
Frei von Banner- und Video-Werbung
Einfach online kündbar

Spiele-Benchmarks

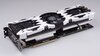
In unseren Benchmarks erreicht die inno3D GTX 980 Ti iChill X3 DHS bis zu 1.443 MHz Takt-Frequenz und liegt damit stolze 240 MHz über dem Maximal-Wert unserer Referenz-GTX-980 Ti (1.202 MHz). Diesen Wert kann die Karte auch über weite Strecken halten und schneidet entsprechend gut ab.

Sie liegt in allen sechs Spielen deutlich an der Spitze und hat auch mit der sehr anspruchsvollen SSAA-Kantenglättung von Metro Last Light und dem speicherhungrigen Rise of the Tomb Raider keine Probleme.

Anno 2205
maximale Details

  • 1920x1080 4xMSAA
  • 2560x1440 4xMSAA
62
45
EVGA GTX 980 Ti SC+ 6.144 MByte
56
41
46
32
AMD R9 FuryX 4.096 MByte
42
33
38
29
35
25
MSI GTX 780 Ti Gaming 3.072 MByte
35
26
MSI R9 390X Gaming 8G 8.192 MByte
34
26
31
24
  • 0
  • 14
  • 28
  • 42
  • 56
  • 70

Battlefield 4
maximale Details, MSAA, Auflösungsskala 100 %

  • 1920x1080 4xAA/16xAF
  • 2560x1440 4xAA/16xAF
137,1
89,3
EVGA GTX 980 Ti SC+ 6.144 MByte
126,8
83,3
98,5
64,6
82,4
50,9
MSI GTX 780 Ti Gaming 3.072 MByte
81,2
51,6
AMD R9 FuryX 4.096 MByte
95,9
65,8
91,4
62,3
MSI R9 390X Gaming 8G 8.192 MByte
84,1
55,3
77,8
51,7
  • 0,0
  • 28,0
  • 56,0
  • 84,0
  • 112,0
  • 140,0

Crysis 3
maximale Details, MSAA

  • 1920x1080 4xAA/16xAF
  • 2560x1440 4xAA/16xAF
84,7
53,4
EVGA GTX 980 Ti SC+ 6.144 MByte
79,3
49,5
60,5
38,0
49,8
30,7
MSI GTX 780 Ti Gaming 3.072 MByte
61,8
37,6
AMD R9 FuryX 4.096 MByte
69,5
47,1
65,5
43,9
MSI R9 390X Gaming 8G 8.192 MByte
59,1
39,9
58,7
38,3
  • 0,0
  • 18,0
  • 36,0
  • 54,0
  • 72,0
  • 90,0

Metro Last Light
maximale Details, SSAA, Tesselation Very High

  • 1920x1080 SSAA/16xAF
  • 2560x1440 SSAA/16xAF
85,7
55,9
EVGA GTX 980 Ti SC+ 6.144 MByte
78,3
50,4
63,2
39,8
50,4
31,3
MSI GTX 780 Ti Gaming 3.072 MByte
55,6
34,9
AMD R9 FuryX 4.096 MByte
64,2
41,9
59,3
38,7
MSI R9 390X Gaming 8G 8.192 MByte
51,9
32,6
48,1
30,6
  • 0,0
  • 18,0
  • 36,0
  • 54,0
  • 72,0
  • 90,0

Rise of the Tomb Raider
Sehr Hohe Details

  • 1920x1080 SMAA
  • 2560x1440 SMAA
78,3
62,7
EVGA GTX 980 Ti SC+ 6.144 MByte
68,8
54,4
56,4
33,6
43,5
31,7
MSI GTX 780 Ti Gaming 3.072 MByte
33,9
21,1
AMD R9 FuryX 4.096 MByte
45,5
38,1
44,4
36,1
MSI R9 390X Gaming 8G 8.192 MByte
47,0
36,8
42,2
32,3
  • 0,0
  • 16,0
  • 32,0
  • 48,0
  • 64,0
  • 80,0

Witcher 3
maximale Details, SSAO, HW off

  • 1920x1080 AA An/Post-Process High
  • 2560x1440 AA An/Post-Process High
95,1
73,0
EVGA GTX 980 Ti SC+ 6.144 MByte
80,4
66,3
70,9
51,7
58,7
41,7
MSI GTX 780 Ti Gaming 3.072 MByte
58,9
44,7
AMD R9 FuryX 4.096 MByte
68,4
55,1
65,6
52,0
MSI R9 390X Gaming 8G 8.192 MByte
56,3
44,1
52,9
41,0
  • 0,0
  • 20,0
  • 40,0
  • 60,0
  • 80,0
  • 100,0

Performance-Rating

Mit elf Prozent Vorsprung zur EVGA Geforce GTX 980 Ti SC+ stellt die inno3D GTX 980 Ti iChill X3 DHS die bislang schnellste Grafikkarte dar, die wir über unseren Benchmark-Parcours geschickt haben. Die Radeon R9 Fury X wird mit fast 40 Prozent Abstand klar in ihre Schranken verwiesen.

Allerdings drückt dabei auch das neu hinzugekommene Rise of the Tomb Raider auf die Durschnitts-fps der Fury X. Die Fijii-Grafikchips der Fury und der Fury X schneiden hier nämlich deutlich schlechter ab als ihre Nvidia-Pendants, auch wenn der Crimson-Treiber 16.2 die Performance etwas verbessert hat. Sollte sich die Situation nicht zeitnahe durch einen Patch oder Treiber-Update verbessern, werden wir wohl künftig wieder auf ein anderes Benchmark-Spiel wechseln.

Maximale Details in Full HD sowie WQHD stellen selbst mit vierfacher Kantenglättung keinerlei Problem für inno3D-Karte dar. Daher muss sich der aufgebohrte GM200-Grafikchip auch in 4K beweisen.

Durchschnitt 1920x1080

  • 1920x1080 4xAA/16xAF
90,5
EVGA GTX 980 Ti SC+ 6.144 MByte
81,6
AMD R9 FuryX 4.096 MByte
64,3
60,7
MSI R9 390X Gaming 8G 8.192 MByte
55,4
MSI GTX 780 Ti Gaming 3.072 MByte
54,4
51,8
  • 0,0
  • 20,0
  • 40,0
  • 60,0
  • 80,0
  • 100,0

Durchschnitt 2560x1440

  • 2560x1440 4xAA/16xAF
63,2
EVGA GTX 980 Ti SC+ 6.144 MByte
57,5
MSI GTX 780 Ti Gaming 3.072 MByte
36,0
AMD R9 FuryX 4.096 MByte
46,8
43,7
MSI R9 390X Gaming 8G 8.192 MByte
39,1
36,3
  • 0,0
  • 14,0
  • 28,0
  • 42,0
  • 56,0
  • 70,0

Insgesamt

  • FPS-Durchschnitt
76,9
EVGA GTX 980 Ti SC+ 6.144 MByte
69,5
MSI GTX 780 Ti Gaming 3.072 MByte
45,2
AMD R9 FuryX 4.096 MByte
55,5
52,2
MSI R9 390X Gaming 8G 8.192 MByte
47,3
44,1
  • 0,0
  • 16,0
  • 32,0
  • 48,0
  • 64,0
  • 80,0

2 von 6

nächste Seite


zu den Kommentaren (49)

Kommentare(46)
Kommentar-Regeln von GameStar
Bitte lies unsere Kommentar-Regeln, bevor Du einen Kommentar verfasst.

Nur angemeldete Benutzer können kommentieren und bewerten.