Seite 2: Nvidia Geforce GTX 1080 Ti - Endlich 4K und 60 fps ohne Einschränkungen?

GameStar Plus Logo
Weiter mit GameStar Plus

Wenn dir gute Spiele wichtig sind.

Besondere Reportagen, Analysen und Hintergründe für Rollenspiel-Helden, Hobbygeneräle und Singleplayer-Fans – von Experten, die wissen, was gespielt wird. Deine Vorteile:

Alle Artikel, Videos & Podcasts von GameStar
Frei von Banner- und Video-Werbung
Einfach online kündbar

Full HD- und WQHD-Benchmarks

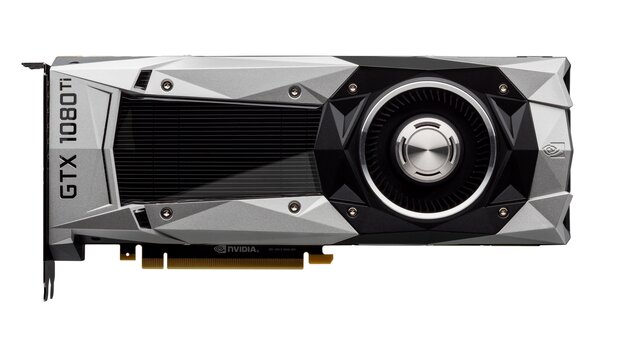
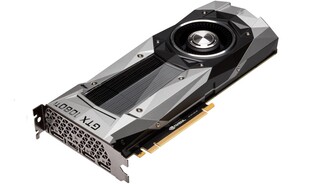
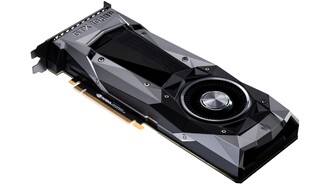
Nvidia Geforce GTX 1080 Ti - Bilder ansehen

Unsere Benchmarks der GTX 1080 Ti haben wir in zwei Kategorien unterteilt. Zuerst finden Sie die Ergebnisse der Full HD- und WQHD-Auflösung sowie deren zugehörige Grafikkarten Rangliste im Performance-Vergleich. Im Anschluss daran in einer Tabelle vereint die Ergebnisse sowie die Rangliste der 4K-Benchmarks.

In Full HD- und WQHD-Auflösung dominiert die Geforce GTX 1080 Ti fast durchgehend das Feld und hebt sich mit eindrucksvollem Abstand vor die GTX 1080. Mit der Titan X liefert sie sich ein Kopf-an-Kopf-Rennen und verbucht leichte Vorteile.

Die angestrebten Taktraten von standardmäßig 1.480 MHz und 1.582 MHz Boost werden unter 1080p und 1440p weit übertroffen und pendeln sich zwischen 1.720 und 1.835 MHz ein – im Idealfall satte 250 MHz mehr, verglichen mit dem von Nvidia angegebenen Boost-Takt.

Es wird allerdings auch klar, dass wir uns in diesen Auflösungen teilweise ins CPU-Limit laufen, der Prozessor die Performance begrenzt und die Grafikkarte nicht ausgelastet wird. Bestes Beispiel hierfür ist »Rise of the Tomb Raider«, selbst eine GTX 1070 ist in Full HD nur sieben Prozent langsamer als die GTX 1080 Ti.

Ashes of the Singularity
DX12

  • 1920x1080 Crazy
  • 2560x1440 Crazy
Geforce GTX 1080 Ti 11.264 MByte
66,3
63,0
Nvidia Titan X 12.288 MByte
63,7
60,7
Radeon R9 FuryX 4.096 MByte
53,1
50,0
Geforce GTX 1080 8.192 MByte
49,9
45,0
49,8
48,8
Geforce GTX 1070 8.192 MByte
48,7
42,2
MSI R9 390X Gaming 8.192 MByte
42,2
37,7
Sapphire R9 390 Nitro 8.192 MByte
40,8
36,8
EVGA GTX 980 Ti SC+ 6.144 MByte
40,5
35,6
MSI R9 290X Gaming 4.096 MByte
39,7
36,4
39,5
33,5
39,4
32,2
38,5
33,7
Asus RX 480 Strix 8.192 MByte
38,1
33,8
Geforce GTX 1060 6.144 MByte
36,3
31,5
36,1
29,5
Radeon RX 480 8.192 MByte
34,8
31,3
Sapphire RX 470 Nitro 4.096 MByte
34,3
31,2
31,2
23,3
XFX R9 380X 4.096 MByte
28,3
25,3
MSI GTX 970 Gaming 4G 4.096 MByte
24,3
19,6
19,4
16,7
EVGA GTX 960 SSC 4.096 MByte
19,2
15,4
  • 0,0
  • 14,0
  • 28,0
  • 42,0
  • 56,0
  • 70,0

Far Cry Primal
maximale Details

  • 1920x1080 SMAA
  • 2560x1440 SMAA
Geforce GTX 1080 Ti 11.264 MByte
107,0
94,6
Nvidia Titan X 12.288 MByte
110,0
95,0
Geforce GTX 1080 8.192 MByte
99,0
74,0
Geforce GTX 1070 8.192 MByte
91,0
63,0
70,0
48,0
68,0
47,0
Geforce GTX 1060 6.144 MByte
66,0
45,0
EVGA GTX 980 Ti SC+ 6.144 MByte
84,0
58,0
70,0
47,0
MSI GTX 970 Gaming 4G 4.096 MByte
56,0
39,0
EVGA GTX 960 SSC 4.096 MByte
38,0
27,0
Asus RX 480 Strix 8.192 MByte
62,0
45,0
Radeon RX 480 8.192 MByte
58,0
41,0
Sapphire RX 470 Nitro 4.096 MByte
58,0
41,0
Radeon R9 FuryX 4.096 MByte
71,0
54,0
68,0
53,0
MSI R9 390X Gaming 8.192 MByte
65,0
49,0
Sapphire R9 390 Nitro 8.192 MByte
61,0
46,0
XFX R9 380X 4.096 MByte
43,0
31,0
MSI R9 290X Gaming 4.096 MByte
60,0
45,0
62,0
43,0
68,0
47,0
42,0
28,0
29,0
20,0
  • 0,0
  • 22,0
  • 44,0
  • 66,0
  • 88,0
  • 110,0

Hitman
maximale Details, DX 12

  • 1920x1080 SMAA
  • 2560x1440 SMAA
Geforce GTX 1080 Ti 11.264 MByte
113,6
112,3
Nvidia Titan X 12.288 MByte
113,4
100,6
Geforce GTX 1080 8.192 MByte
99,3
78,8
Geforce GTX 1070 8.192 MByte
88,0
64,9
72,2
53,0
68,6
50,3
Geforce GTX 1060 6.144 MByte
65,5
48,0
EVGA GTX 980 Ti SC+ 6.144 MByte
79,2
58,7
68,2
49,1
MSI GTX 970 Gaming 4G 4.096 MByte
51,9
37,8
EVGA GTX 960 SSC 4.096 MByte
37,4
27,3
Asus RX 480 Strix 8.192 MByte
77,4
55,3
Radeon RX 480 8.192 MByte
73,7
53,6
Sapphire RX 470 Nitro 4.096 MByte
71,6
50,3
Radeon R9 FuryX 4.096 MByte
90,7
71,8
85,3
67,8
MSI R9 390X Gaming 8.192 MByte
80,6
62,7
Sapphire R9 390 Nitro 8.192 MByte
74,4
57,9
XFX R9 380X 4.096 MByte
57,0
43,1
MSI R9 290X Gaming 4.096 MByte
74,6
58,2
59,5
42,3
71,5
52,8
44,7
32,1
19,4
11,7
  • 0,0
  • 24,0
  • 48,0
  • 72,0
  • 96,0
  • 120,0

Rise of the Tomb Raider
Sehr Hohe Details, DX11

  • 1920x1080 SMAA
  • 2560x1440 SMAA
Geforce GTX 1080 Ti 11.264 MByte
81,8
77,6
Nvidia Titan X 12.288 MByte
76,9
71,2
Geforce GTX 1080 8.192 MByte
81,2
66,3
Geforce GTX 1070 8.192 MByte
75,0
56,5
57,6
42,0
56,5
40,8
Geforce GTX 1060 6.144 MByte
54,5
38,9
EVGA GTX 980 Ti SC+ 6.144 MByte
68,8
54,4
60,2
44,7
MSI GTX 970 Gaming 4G 4.096 MByte
43,5
31,7
EVGA GTX 960 SSC 4.096 MByte
31,2
22,3
Asus RX 480 Strix 8.192 MByte
48,3
35,9
Radeon RX 480 8.192 MByte
47,7
34,5
Sapphire RX 470 Nitro 4.096 MByte
44,2
31,4
Radeon R9 FuryX 4.096 MByte
46,8
38,1
44,4
36,1
MSI R9 390X Gaming 8.192 MByte
49,0
38,8
Sapphire R9 390 Nitro 8.192 MByte
44,2
34,3
XFX R9 380X 4.096 MByte
33,9
23,5
MSI R9 290X Gaming 4.096 MByte
45,2
35,6
39,3
29,6
56,3
40,7
33,2
24,3
  • 0,0
  • 18,0
  • 36,0
  • 54,0
  • 72,0
  • 90,0

Witcher 3
maximale Details, SSAO, HW off

  • 1920x1080
  • 2560x1440
Geforce GTX 1080 Ti 11.264 MByte
115,6
100,6
Nvidia Titan X 12.288 MByte
114,1
101,1
Geforce GTX 1080 8.192 MByte
101,3
78,5
Geforce GTX 1070 8.192 MByte
89,7
65,7
70,9
49,8
69,4
48,7
Geforce GTX 1060 6.144 MByte
66,9
46,7
EVGA GTX 980 Ti SC+ 6.144 MByte
80,4
66,3
70,9
51,7
MSI GTX 970 Gaming 4G 4.096 MByte
58,7
41,7
EVGA GTX 960 SSC 4.096 MByte
39,5
27,1
Asus RX 480 Strix 8.192 MByte
67,5
48,9
Radeon RX 480 8.192 MByte
62,8
45,2
Sapphire RX 470 Nitro 4.096 MByte
61,3
44,4
Radeon R9 FuryX 4.096 MByte
73,0
57,4
67,2
53,1
MSI R9 390X Gaming 8.192 MByte
57,3
44,1
Sapphire R9 390 Nitro 8.192 MByte
53,9
42,0
XFX R9 380X 4.096 MByte
43,7
32,6
MSI R9 290X Gaming 4.096 MByte
52,3
41,8
65,1
45,6
69,1
48,2
43,2
30,2
31,1
21,4
  • 0,0
  • 24,0
  • 48,0
  • 72,0
  • 96,0
  • 120,0

Performance Rangliste Full HD und WQHD

Je höher die Auflösung, desto stärker spielt die GTX 1080 Ti das restliche Feld an die Wand – mit Ausnahme der Titan X, die sie im Mittel nur um drei Prozent übertrifft.

In Full HD wird eine GTX 1080 um zwölf Prozent geschlagen, in WQHD sind es bereits 31 Prozent. Ihre direkte 980 Ti-Vorgängerin, hier in Form der von Haus aus übertakteten EVGA GTX 980 Ti SC, lässt sie weit hinter sich: In Full HD ist die GTX 1080 Ti 37 Prozent flotter, in 1440p beträgt der Abstand schon 64 Prozent.

Durchschnitt 1920x1080

  • 1920x1080
Geforce GTX 1080 Ti 11.264 MByte
96,6
Nvidia Titan X 12.288 MByte
95,6
Geforce GTX 1080 8.192 MByte
86,1
Geforce GTX 1070 8.192 MByte
78,5
EVGA GTX 980 Ti SC+ 6.144 MByte
70,6
Radeon R9 FuryX 4.096 MByte
66,9
62,9
62,0
61,1
MSI R9 390X Gaming 8.192 MByte
58,8
Asus RX 480 Strix 8.192 MByte
58,7
Geforce GTX 1060 6.144 MByte
57,8
Radeon RX 480 8.192 MByte
55,4
Sapphire R9 390 Nitro 8.192 MByte
54,9
MSI R9 290X Gaming 4.096 MByte
54,4
Sapphire RX 470 Nitro 4.096 MByte
53,9
MSI GTX 970 Gaming 4G 4.096 MByte
46,9
XFX R9 380X 4.096 MByte
41,2
EVGA GTX 960 SSC 4.096 MByte
33,1
  • 0,0
  • 20,0
  • 40,0
  • 60,0
  • 80,0
  • 100,0

Durchschnitt 2560x1440

  • 2560x1440
Geforce GTX 1080 Ti 11.264 MByte
89,6
Nvidia Titan X 12.288 MByte
85,7
Geforce GTX 1080 8.192 MByte
68,5
Geforce GTX 1070 8.192 MByte
58,5
45,3
Geforce GTX 1060 6.144 MByte
42,0
EVGA GTX 980 Ti SC+ 6.144 MByte
54,6
44,4
MSI GTX 970 Gaming 4G 4.096 MByte
34,0
EVGA GTX 960 SSC 4.096 MByte
23,8
Asus RX 480 Strix 8.192 MByte
43,8
Radeon RX 480 8.192 MByte
41,1
Sapphire RX 470 Nitro 4.096 MByte
39,7
Radeon R9 FuryX 4.096 MByte
54,3
51,8
MSI R9 390X Gaming 8.192 MByte
46,5
Sapphire R9 390 Nitro 8.192 MByte
43,4
XFX R9 380X 4.096 MByte
31,1
MSI R9 290X Gaming 4.096 MByte
43,4
  • 0,0
  • 18,0
  • 36,0
  • 54,0
  • 72,0
  • 90,0

Insgesamt

  • FPS-Durchschnitt
Geforce GTX 1080 Ti 11.264 MByte
93,1
Nvidia Titan X 12.288 MByte
90,7
Geforce GTX 1080 8.192 MByte
77,3
Geforce GTX 1070 8.192 MByte
68,5
53,7
Geforce GTX 1060 6.144 MByte
49,9
EVGA GTX 980 Ti SC+ 6.144 MByte
62,6
52,7
MSI GTX 970 Gaming 4G 4.096 MByte
40,4
EVGA GTX 960 SSC 4.096 MByte
28,4
Asus RX 480 Strix 8.192 MByte
51,2
Radeon RX 480 8.192 MByte
48,3
Sapphire RX 470 Nitro 4.096 MByte
46,8
Radeon R9 FuryX 4.096 MByte
60,6
57,4
MSI R9 390X Gaming 8.192 MByte
52,6
Sapphire R9 390 Nitro 8.192 MByte
49,1
XFX R9 380X 4.096 MByte
36,1
MSI R9 290X Gaming 4.096 MByte
48,9
  • 0,0
  • 20,0
  • 40,0
  • 60,0
  • 80,0
  • 100,0

2 von 6

nächste Seite


zu den Kommentaren (87)

Kommentare(85)
Kommentar-Regeln von GameStar
Bitte lies unsere Kommentar-Regeln, bevor Du einen Kommentar verfasst.

Nur angemeldete Benutzer können kommentieren und bewerten.